PicoCalc Screen Colors

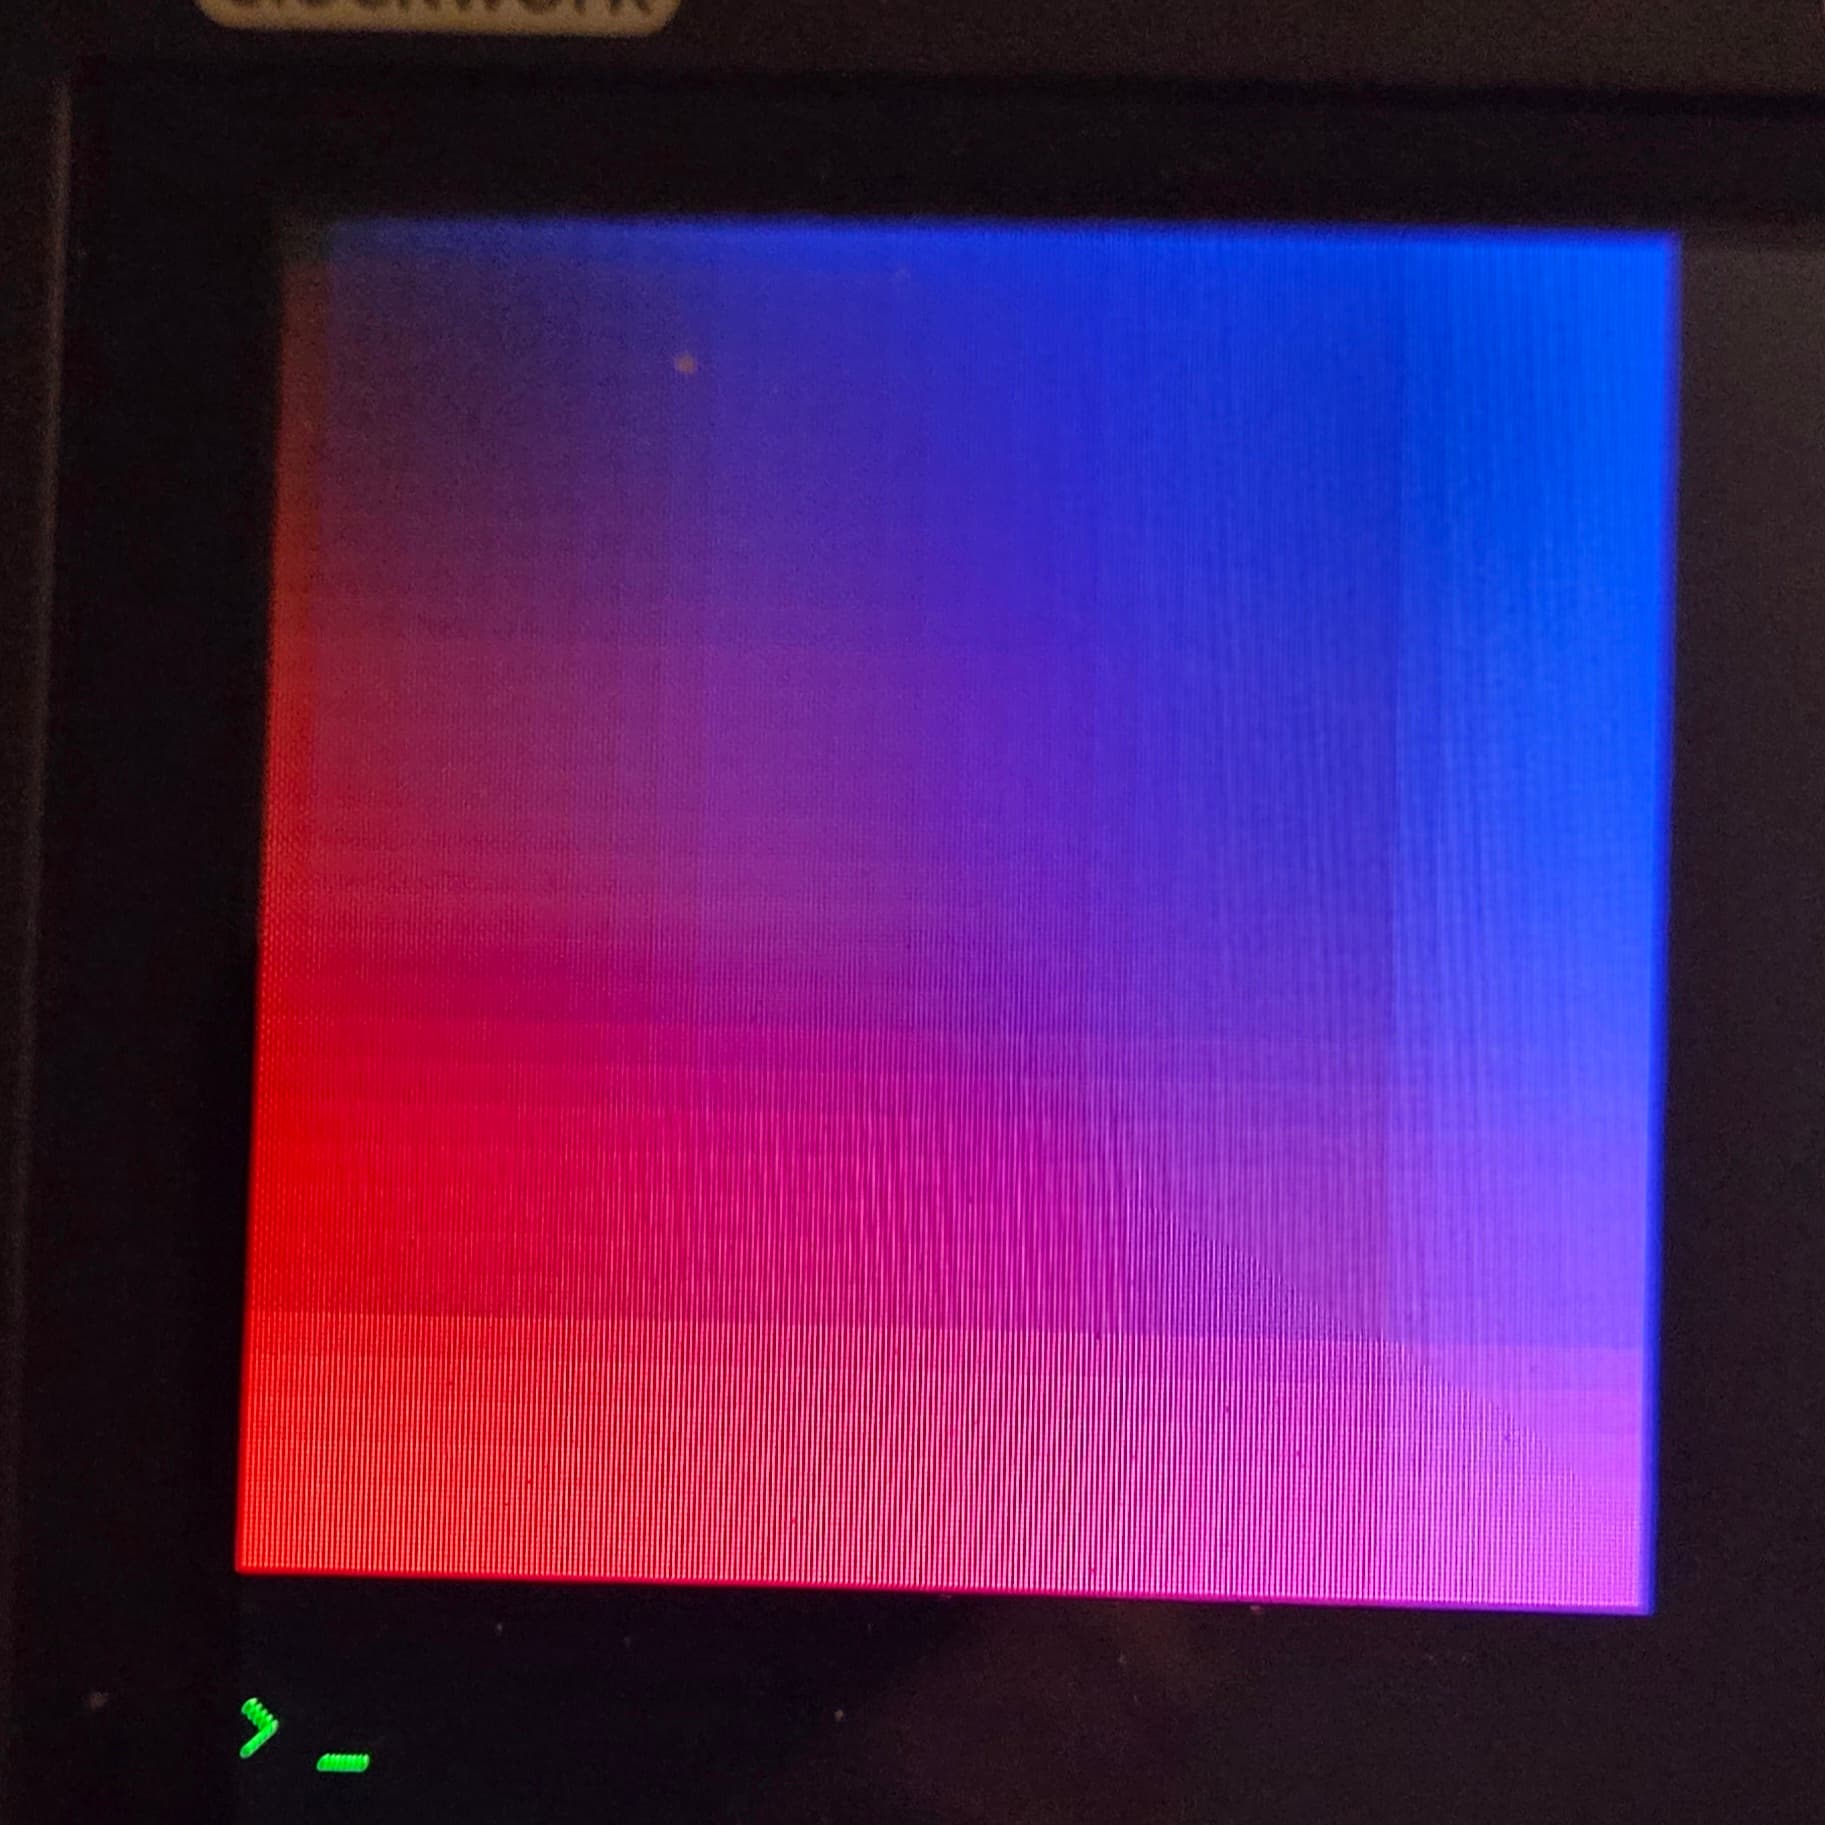
I was playing around with the graphics and when I did a 256^2 red/blue plot, there appeared to be a lot of banding… that spot’s not dead pixels, just some junk on the screen


it looked like the bands were 8 pixels wide, so I altered the program to a full 32^3 RGB plot.

Sorry for the image quality, but you get the idea. Am I correct in assuming the range is effectively 32676 (2^15) colors?

The LCD panel is being driven in RGB565 mode, so yes. But you get 1 more bit of green!

Ah, I’d seen that somewhere but it didn’t click. So the palette moves up to 65536!

If I understand the LCD datasheet it supports 65K colours (RGB565) and 262K colours (RGB666). Is it possible to switch between these modes?

1 Like

I can’t find a datasheet for the ST7796SP, or any detailed spec sheet for the PicoCalc, to see if it’s 666 RGB, or 888 RGB, are supported.

There are commands in MMBASIC that lets you communicate with SPI devices, but I haven’t found anything yet about setting the color format.

PicoCalc/ST7365P_SPEC_V1.0.pdf at master · clockworkpi/PicoCalc · GitHub ?

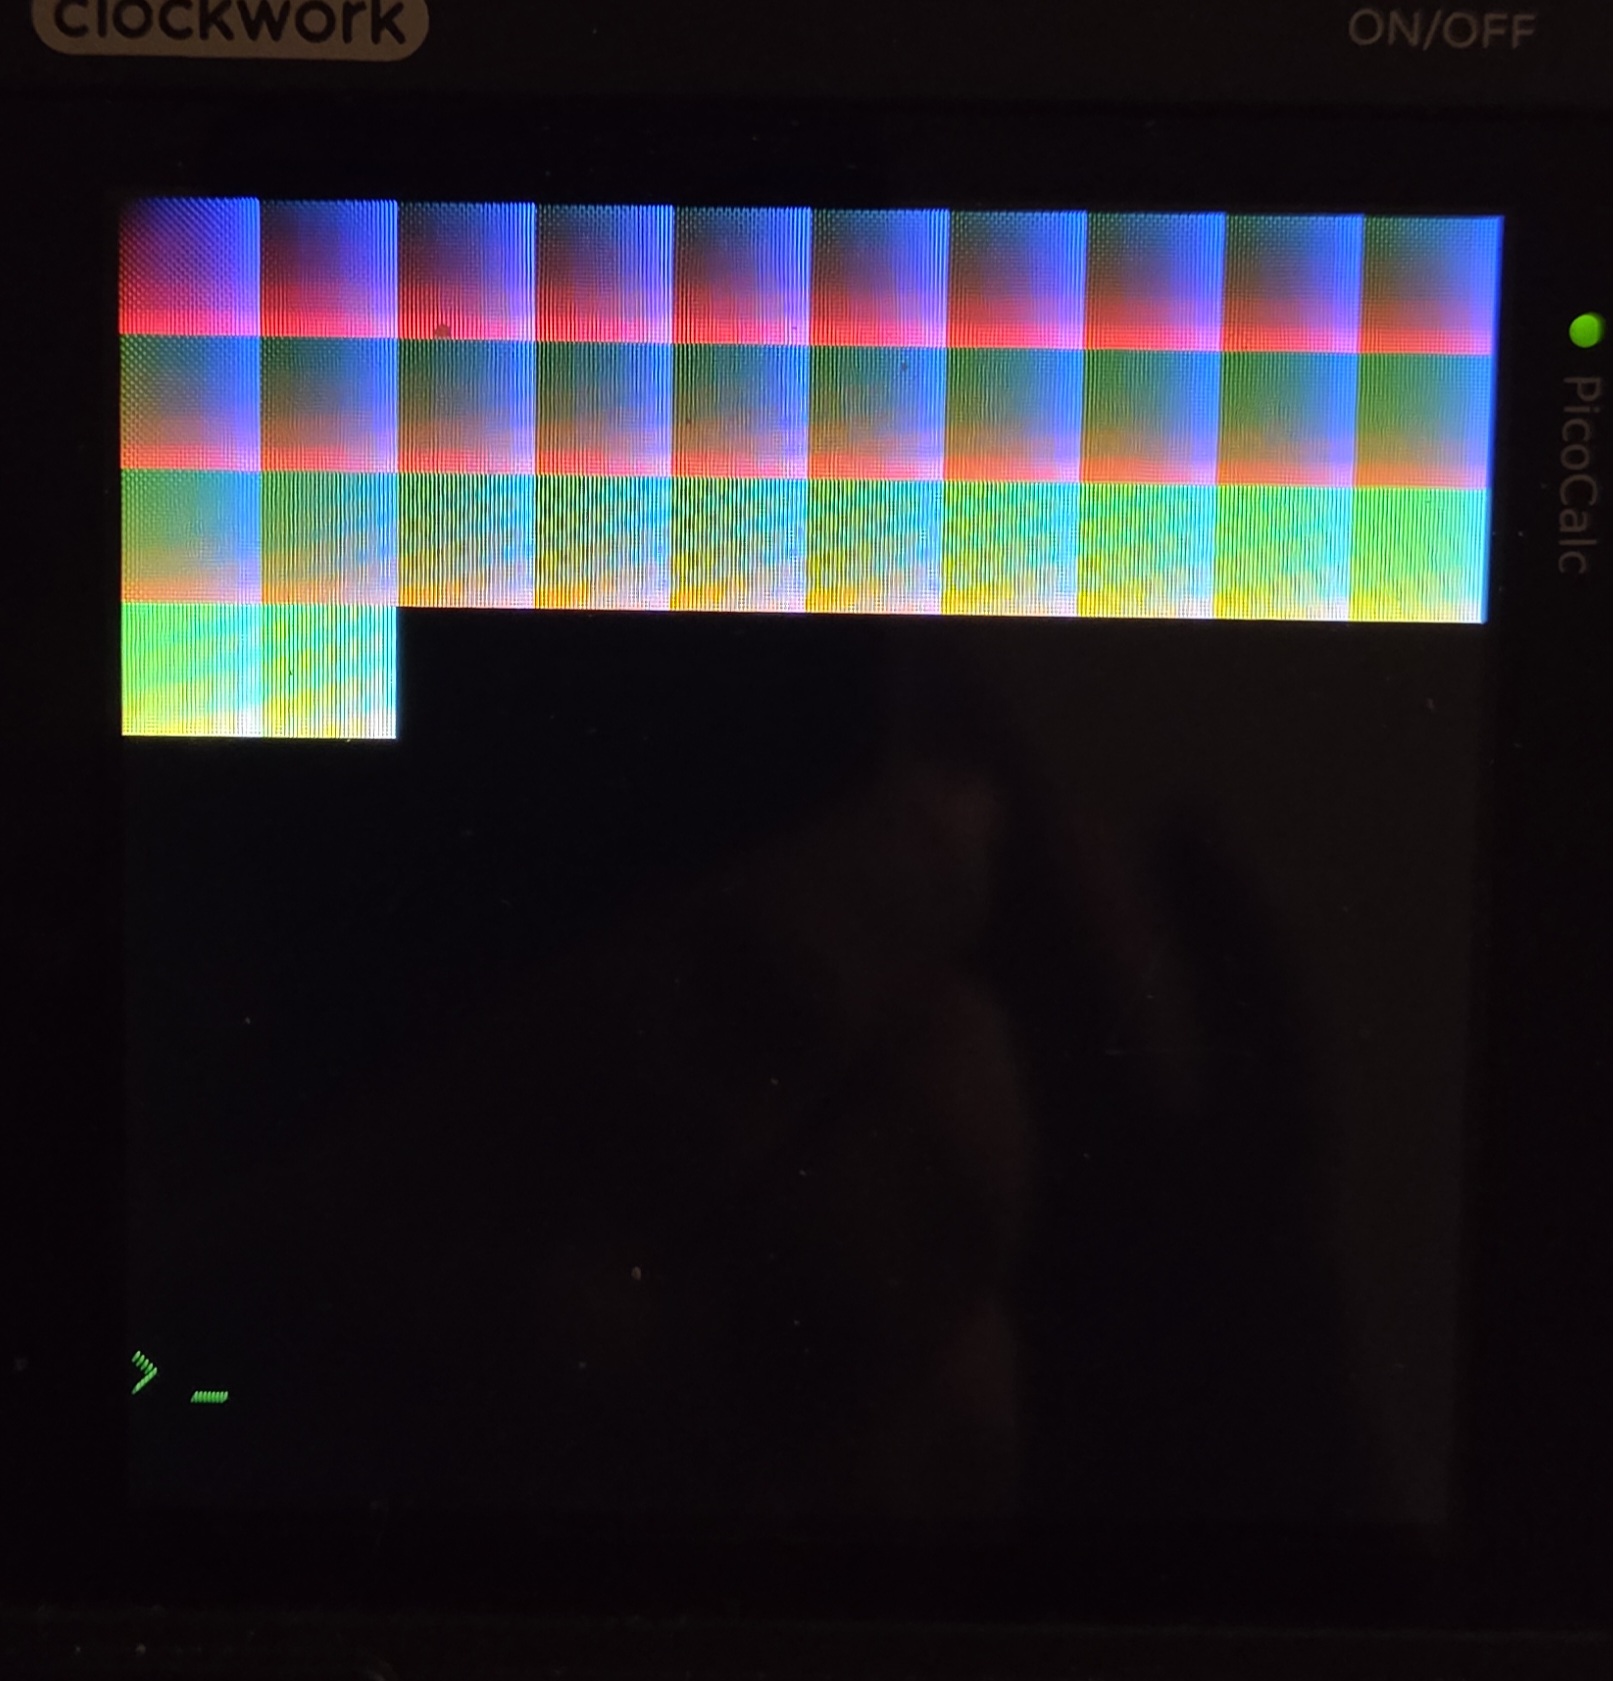
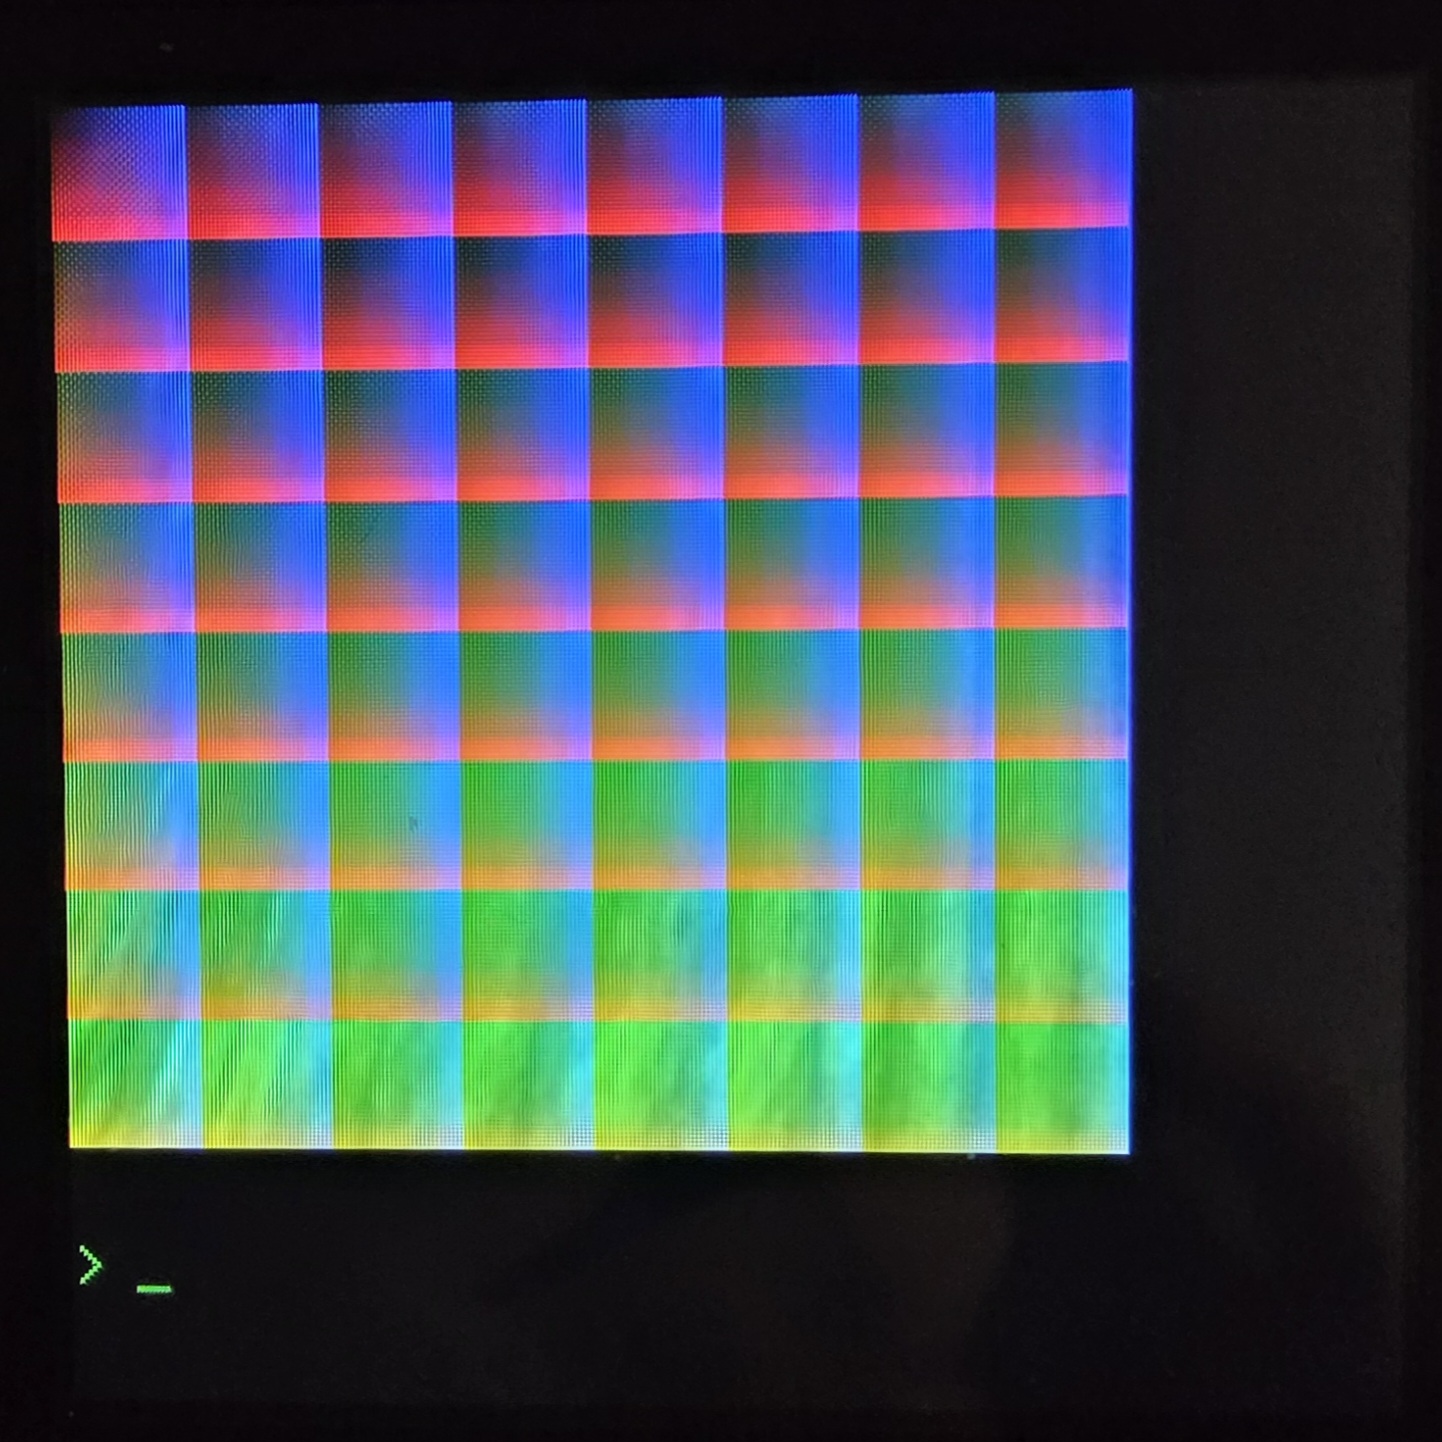
specifically page 80 93 details the different RGB modes, for 4-wire SPI there is RGB565 (16bit) and RGB666 (18bit)

although, if MMBasic itself doesn’t have an RGB666 mode (especially counting how it has to deal with framebuffers), pushing the raw command to the display driver will likely result in nothing more than a glitched screen

Thanks.

My PicoCalc hasn’t shipped yet for me to trying playing with it so just trying to understand all about it.