## Basic information
- Board URL (official): https://www.raspberrypi.com/products/compute-module-5/
- Board purchased from: Provided by Raspberry Pi
- Board purchase date: November, 2024
- Board specs (as tested): 4GB RAM, 32GB eMMC (also 8GB RAM, 8GB eMMC as noted)
- Board price (as tested): $70
All tests were run on the 4GB board, except as noted. Some tests scale with RAM.
## Linux/system information
```
# output of `screenfetch`
_,met$$$$$gg. pi@cm5
,g$$$$$$$$$$$$$$$P. OS: Debian 12 bookworm
,g$$P"" """Y$$.". Kernel: aarch64 Linux 6.6.51+rpt-rpi-2712
,$$P' `$$$. Uptime: 12m
',$$P ,ggs. `$$b: Packages: 1630
`d$$' ,$P"' . $$$ Shell: bash 5.2.15
$$P d$' , $$P Disk: 9.4G / 237G (5%)
$$: $$. - ,d$$' CPU: ARM Cortex-A76 @ 4x 2.4GHz
$$\; Y$b._ _,d$P' GPU:
Y$$. `.`"Y$$$$P"' RAM: 677MiB / 4045MiB
`$$b "-.__
`Y$$
`Y$$.
`$$b.
`Y$$b.
`"Y$b._
`""""
# output of `uname -a`
Linux cm5 6.6.51+rpt-rpi-2712 #1 SMP PREEMPT Debian 1:6.6.51-1+rpt3 (2024-10-08) aarch64 GNU/Linux
```
## Benchmark results
### CPU
- Geekbench 6: (804 single / 1651 multi - https://browser.geekbench.com/v6/cpu/9095882)
- Geekbench 6: (892 single / 2128 multi - https://browser.geekbench.com/v6/cpu/9331638) (after Dec 9 Pi OS update)
- 26.15 Gflops / **2.79 Gflops/W** ([geerlingguy/top500-benchmark](https://github.com/geerlingguy/top500-benchmark) [HPL result](https://github.com/geerlingguy/top500-benchmark/issues/48)) - 31.48 Gflops for 8GB (3.147 Gflops/W)
- 32.152 Gflops / **3.49 Gflops/W** (4GB after Dec 9 Pi OS update)
### Power
- Idle power draw (at wall): 2.4 W (2.3 W for 'Lite' models)
- Maximum simulated power draw (`stress-ng --matrix 0`): 8.5 W
- During Geekbench multicore benchmark: 8.2 W
- During `top500` HPL benchmark: 9.4 W (10 W on 8GB)
### Disk
#### Pinedrive 256GB 2242 NVMe SSD at PCIe Gen 3
| Benchmark | Result |
| -------------------------- | ------ |
| iozone 4K random read | 63.01 MB/s |
| iozone 4K random write | 298.06 MB/s |
| iozone 1M random read | 820.16 MB/s |
| iozone 1M random write | 759.24 MB/s |
| iozone 1M sequential read | 823.04 MB/s |
| iozone 1M sequential write | 758.51 MB/s |
#### Built-in eMMC (32GB)
| Benchmark | Result |
| -------------------------- | ------ |
| iozone 4K random read | 34.71 MB/s |
| iozone 4K random write | 61.80 MB/s |
| iozone 1M random read | 314.97 MB/s |
| iozone 1M random write | 108.32 MB/s |
| iozone 1M sequential read | 316.19 MB/s |
| iozone 1M sequential write | 109.71 MB/s |
```
wget https://raw.githubusercontent.com/geerlingguy/pi-cluster/master/benchmarks/disk-benchmark.sh
chmod +x disk-benchmark.sh
sudo MOUNT_PATH=/ TEST_SIZE=1g ./disk-benchmark.sh
```
### Network
`iperf3` results:
### Built-in 1 Gbps Ethernet (BCM54210PE)
- `iperf3 -c $SERVER_IP`: 938 Mbps
- `iperf3 -c $SERVER_IP --reverse`: 884 Mbps
- `iperf3 -c $SERVER_IP --bidir`: 931 Mbps up, 663 Mbps down
### WiFi (built-in PCB antenna)
- `iperf3 -c $SERVER_IP`: 249 Mbps
- `iperf3 -c $SERVER_IP --reverse`: 240 Mbps
- `iperf3 -c $SERVER_IP --bidir`: 133 Mbps up, 96.6 Mbps down
```
pi@cm5:~ $ iwconfig wlan0
wlan0 IEEE 802.11 ESSID:"GE_5G"
Mode:Managed Frequency:5.2 GHz Access Point: 6C:CD:D6:61:8F:21
Bit Rate=390 Mb/s Tx-Power=31 dBm
Retry short limit:7 RTS thr:off Fragment thr:off
Power Management:on
Link Quality=57/70 Signal level=-53 dBm
Rx invalid nwid:0 Rx invalid crypt:0 Rx invalid frag:0
Tx excessive retries:0 Invalid misc:0 Missed beacon:0
```
### WiFi (external antenna)
- `iperf3 -c $SERVER_IP`: 250 Mbps
- `iperf3 -c $SERVER_IP --reverse`: 245 Mbps
- `iperf3 -c $SERVER_IP --bidir`: 113 Mbps up, 120 Mbps down
```
pi@cm5:~ $ iwconfig wlan0
wlan0 IEEE 802.11 ESSID:"GE_5G"
Mode:Managed Frequency:5.2 GHz Access Point: 6C:CD:D6:61:8F:21
Bit Rate=433.3 Mb/s Tx-Power=31 dBm
Retry short limit:7 RTS thr:off Fragment thr:off
Power Management:on
Link Quality=53/70 Signal level=-57 dBm
Rx invalid nwid:0 Rx invalid crypt:0 Rx invalid frag:0
Tx excessive retries:18 Invalid misc:0 Missed beacon:0
```
(Measured for optimal antenna orientation with `sudo apt install wavemon`, and `wavemon`)
## GPU
### glmark2
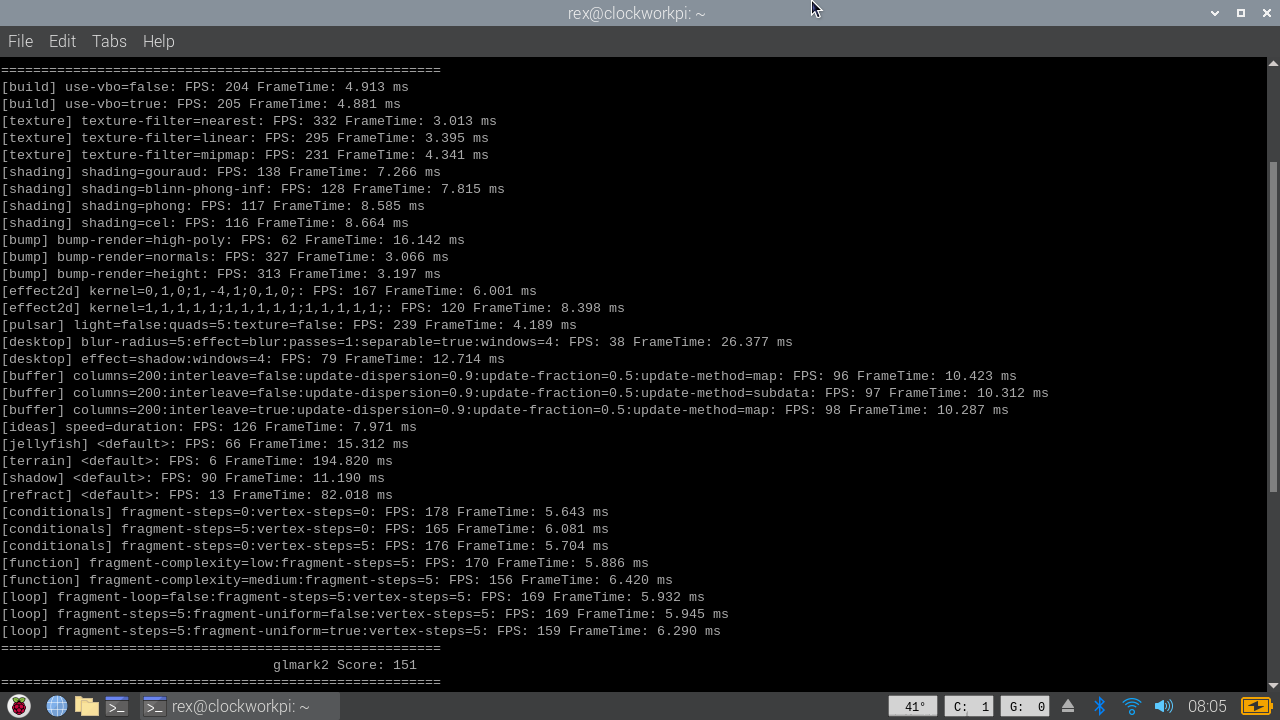
`glmark2-es2` / `glmark2-es2-wayland` results:
```
=======================================================
glmark2 2023.01
=======================================================
OpenGL Information
GL_VENDOR: Broadcom
GL_RENDERER: V3D 7.1
GL_VERSION: OpenGL ES 3.1 Mesa 23.2.1-1~bpo12+rpt3
Surface Config: buf=32 r=8 g=8 b=8 a=8 depth=24 stencil=0 samples=0
Surface Size: 800x600 windowed
=======================================================
[build] use-vbo=false: FPS: 2563 FrameTime: 0.390 ms
[build] use-vbo=true: FPS: 3419 FrameTime: 0.293 ms
[texture] texture-filter=nearest: FPS: 2839 FrameTime: 0.352 ms
[texture] texture-filter=linear: FPS: 2839 FrameTime: 0.352 ms
[texture] texture-filter=mipmap: FPS: 2883 FrameTime: 0.347 ms
[shading] shading=gouraud: FPS: 2867 FrameTime: 0.349 ms
[shading] shading=blinn-phong-inf: FPS: 2487 FrameTime: 0.402 ms
[shading] shading=phong: FPS: 2109 FrameTime: 0.474 ms
[shading] shading=cel: FPS: 2045 FrameTime: 0.489 ms
[bump] bump-render=high-poly: FPS: 1406 FrameTime: 0.711 ms
[bump] bump-render=normals: FPS: 3072 FrameTime: 0.326 ms
[bump] bump-render=height: FPS: 2873 FrameTime: 0.348 ms
[effect2d] kernel=0,1,0;1,-4,1;0,1,0;: FPS: 1176 FrameTime: 0.851 ms
[effect2d] kernel=1,1,1,1,1;1,1,1,1,1;1,1,1,1,1;: FPS: 482 FrameTime: 2.078 ms
[pulsar] light=false:quads=5:texture=false: FPS: 2943 FrameTime: 0.340 ms
[desktop] blur-radius=5:effect=blur:passes=1:separable=true:windows=4: FPS: 289 FrameTime: 3.467 ms
[desktop] effect=shadow:windows=4: FPS: 1080 FrameTime: 0.926 ms
[buffer] columns=200:interleave=false:update-dispersion=0.9:update-fraction=0.5:update-method=map: FPS: 537 FrameTime: 1.863 ms
[buffer] columns=200:interleave=false:update-dispersion=0.9:update-fraction=0.5:update-method=subdata: FPS: 529 FrameTime: 1.893 ms
[buffer] columns=200:interleave=true:update-dispersion=0.9:update-fraction=0.5:update-method=map: FPS: 570 FrameTime: 1.755 ms
[ideas] speed=duration: FPS: 2264 FrameTime: 0.442 ms
[jellyfish] <default>: FPS: 1211 FrameTime: 0.826 ms
[terrain] <default>: FPS: 77 FrameTime: 13.035 ms
[shadow] <default>: FPS: 184 FrameTime: 5.463 ms
[refract] <default>: FPS: 84 FrameTime: 11.928 ms
[conditionals] fragment-steps=0:vertex-steps=0: FPS: 3268 FrameTime: 0.306 ms
[conditionals] fragment-steps=5:vertex-steps=0: FPS: 2297 FrameTime: 0.435 ms
[conditionals] fragment-steps=0:vertex-steps=5: FPS: 3222 FrameTime: 0.310 ms
[function] fragment-complexity=low:fragment-steps=5: FPS: 2733 FrameTime: 0.366 ms
[function] fragment-complexity=medium:fragment-steps=5: FPS: 1898 FrameTime: 0.527 ms
[loop] fragment-loop=false:fragment-steps=5:vertex-steps=5: FPS: 2618 FrameTime: 0.382 ms
[loop] fragment-steps=5:fragment-uniform=false:vertex-steps=5: FPS: 2622 FrameTime: 0.381 ms
[loop] fragment-steps=5:fragment-uniform=true:vertex-steps=5: FPS: 1778 FrameTime: 0.563 ms
=======================================================
glmark2 Score: 1916
=======================================================
```
Note: This benchmark requires an active display on the device. Not all devices may be able to run `glmark2-es2`, so in that case, make a note and move on!
### Ollama
`ollama` LLM model inference results:
| Pi Model | CPU/GPU | LLM | Rate |
| :-- | :-- | :-- | :-- |
| Raspberry Pi CM5 - 4GB | CPU | llama3.2:3b | 4.58 Tokens/s |
| Raspberry Pi CM5 - 8GB | CPU | llama3.2:3b | 4.53 Tokens/s |
| Raspberry Pi CM5 - 8GB | CPU | llama3.1:8b | 1.93 Tokens/s |
Power consumption was a steady 9.3W during inference.
## Memory
`tinymembench` results:
<details>
<summary>Click to expand memory benchmark result</summary>
```
tinymembench v0.4.10 (simple benchmark for memory throughput and latency)
==========================================================================
== Memory bandwidth tests ==
== ==
== Note 1: 1MB = 1000000 bytes ==
== Note 2: Results for 'copy' tests show how many bytes can be ==
== copied per second (adding together read and writen ==
== bytes would have provided twice higher numbers) ==
== Note 3: 2-pass copy means that we are using a small temporary buffer ==
== to first fetch data into it, and only then write it to the ==
== destination (source -> L1 cache, L1 cache -> destination) ==
== Note 4: If sample standard deviation exceeds 0.1%, it is shown in ==
== brackets ==
==========================================================================
C copy backwards : 5303.7 MB/s (0.2%)
C copy backwards (32 byte blocks) : 5333.1 MB/s (0.2%)
C copy backwards (64 byte blocks) : 5328.4 MB/s
C copy : 6061.3 MB/s (0.1%)
C copy prefetched (32 bytes step) : 6031.9 MB/s
C copy prefetched (64 bytes step) : 6036.9 MB/s
C 2-pass copy : 5433.6 MB/s
C 2-pass copy prefetched (32 bytes step) : 6003.8 MB/s (0.1%)
C 2-pass copy prefetched (64 bytes step) : 5996.6 MB/s
C fill : 12660.7 MB/s (0.2%)
C fill (shuffle within 16 byte blocks) : 12630.7 MB/s
C fill (shuffle within 32 byte blocks) : 12628.8 MB/s
C fill (shuffle within 64 byte blocks) : 12642.2 MB/s
NEON 64x2 COPY : 5996.0 MB/s (1.0%)
NEON 64x2x4 COPY : 5996.6 MB/s
NEON 64x1x4_x2 COPY : 6006.0 MB/s
NEON 64x2 COPY prefetch x2 : 5517.6 MB/s
NEON 64x2x4 COPY prefetch x1 : 5587.1 MB/s
NEON 64x2 COPY prefetch x1 : 5494.3 MB/s
NEON 64x2x4 COPY prefetch x1 : 5596.0 MB/s (0.6%)
---
standard memcpy : 6012.7 MB/s
standard memset : 12646.0 MB/s (0.3%)
---
NEON LDP/STP copy : 6012.5 MB/s (0.1%)
NEON LDP/STP copy pldl2strm (32 bytes step) : 6014.6 MB/s (0.2%)
NEON LDP/STP copy pldl2strm (64 bytes step) : 6013.5 MB/s
NEON LDP/STP copy pldl1keep (32 bytes step) : 5997.7 MB/s
NEON LDP/STP copy pldl1keep (64 bytes step) : 5995.9 MB/s
NEON LD1/ST1 copy : 6002.0 MB/s
NEON STP fill : 12634.8 MB/s (0.8%)
NEON STNP fill : 12640.2 MB/s (0.7%)
ARM LDP/STP copy : 6011.4 MB/s (0.6%)
ARM STP fill : 12403.9 MB/s (0.4%)
ARM STNP fill : 12408.2 MB/s (0.2%)
==========================================================================
== Framebuffer read tests. ==
== ==
== Many ARM devices use a part of the system memory as the framebuffer, ==
== typically mapped as uncached but with write-combining enabled. ==
== Writes to such framebuffers are quite fast, but reads are much ==
== slower and very sensitive to the alignment and the selection of ==
== CPU instructions which are used for accessing memory. ==
== ==
== Many x86 systems allocate the framebuffer in the GPU memory, ==
== accessible for the CPU via a relatively slow PCI-E bus. Moreover, ==
== PCI-E is asymmetric and handles reads a lot worse than writes. ==
== ==
== If uncached framebuffer reads are reasonably fast (at least 100 MB/s ==
== or preferably >300 MB/s), then using the shadow framebuffer layer ==
== is not necessary in Xorg DDX drivers, resulting in a nice overall ==
== performance improvement. For example, the xf86-video-fbturbo DDX ==
== uses this trick. ==
==========================================================================
NEON LDP/STP copy (from framebuffer) : 1939.3 MB/s (0.7%)
NEON LDP/STP 2-pass copy (from framebuffer) : 1737.0 MB/s (0.2%)
NEON LD1/ST1 copy (from framebuffer) : 1945.3 MB/s (0.2%)
NEON LD1/ST1 2-pass copy (from framebuffer) : 1736.1 MB/s
ARM LDP/STP copy (from framebuffer) : 1894.0 MB/s (0.1%)
ARM LDP/STP 2-pass copy (from framebuffer) : 1732.5 MB/s (0.1%)
==========================================================================
== Memory latency test ==
== ==
== Average time is measured for random memory accesses in the buffers ==
== of different sizes. The larger is the buffer, the more significant ==
== are relative contributions of TLB, L1/L2 cache misses and SDRAM ==
== accesses. For extremely large buffer sizes we are expecting to see ==
== page table walk with several requests to SDRAM for almost every ==
== memory access (though 64MiB is not nearly large enough to experience ==
== this effect to its fullest). ==
== ==
== Note 1: All the numbers are representing extra time, which needs to ==
== be added to L1 cache latency. The cycle timings for L1 cache ==
== latency can be usually found in the processor documentation. ==
== Note 2: Dual random read means that we are simultaneously performing ==
== two independent memory accesses at a time. In the case if ==
== the memory subsystem can't handle multiple outstanding ==
== requests, dual random read has the same timings as two ==
== single reads performed one after another. ==
==========================================================================
block size : single random read / dual random read
1024 : 0.0 ns / 0.0 ns
2048 : 0.0 ns / 0.0 ns
4096 : 0.0 ns / 0.0 ns
8192 : 0.0 ns / 0.0 ns
16384 : 0.0 ns / 0.0 ns
32768 : 0.0 ns / 0.0 ns
65536 : 0.0 ns / 0.0 ns
131072 : 1.1 ns / 1.5 ns
262144 : 1.6 ns / 2.0 ns
524288 : 2.3 ns / 2.9 ns
1048576 : 8.3 ns / 11.3 ns
2097152 : 15.1 ns / 19.0 ns
4194304 : 51.5 ns / 77.4 ns
8388608 : 79.8 ns / 108.0 ns
16777216 : 94.9 ns / 119.5 ns
33554432 : 104.4 ns / 126.1 ns
67108864 : 110.0 ns / 130.3 ns
```
</details>
## `sbc-bench` results
Run sbc-bench and paste a link to the results here: https://0x0.st/XRKg.txt
## Phoronix Test Suite
Results from [pi-general-benchmark.sh](https://gist.github.com/geerlingguy/570e13f4f81a40a5395688667b1f79af):
### Launch version of Pi OS
- pts/encode-mp3: 11.739 sec
- pts/x264 4K: 4.32 fps
- pts/x264 1080p: 18.06 fps
- pts/phpbench: 435778
- pts/build-linux-kernel (defconfig): 2222.151 sec
### December update (Pi OS with NUMA faking and SDRAM tweaks)
- pts/encode-mp3: 11.708 sec
- pts/x264 4K: 4.08 fps
- pts/x264 1080p: 17.63 fps
- pts/phpbench: 431800
- pts/build-linux-kernel (defconfig): 2110.457 sec
## Other benchmarks
- Boot time (Pi OS 64-bit Desktop): 22.92s to SSH login, 23.90s to GUI with menu bar